Seeking Alpha is proud to welcome Michael P. McCarthy as a new contributor. It's easy to become a Seeking Alpha contributor and earn money for your best investment ideas. Active contributors also get free access to the SA PRO archive.
There's been a lot of talk about "Robinhooders" piling into risky stocks over the past few months, but I've yet to see much data that could explain the influence that this relatively small brokerage could have on price discovery. Using the website robintrack.net, which publishes a history of the total numbers of "owners" of each individual stock in the Robinhood universe, I decided to aggregate the data to see for myself.
Summary
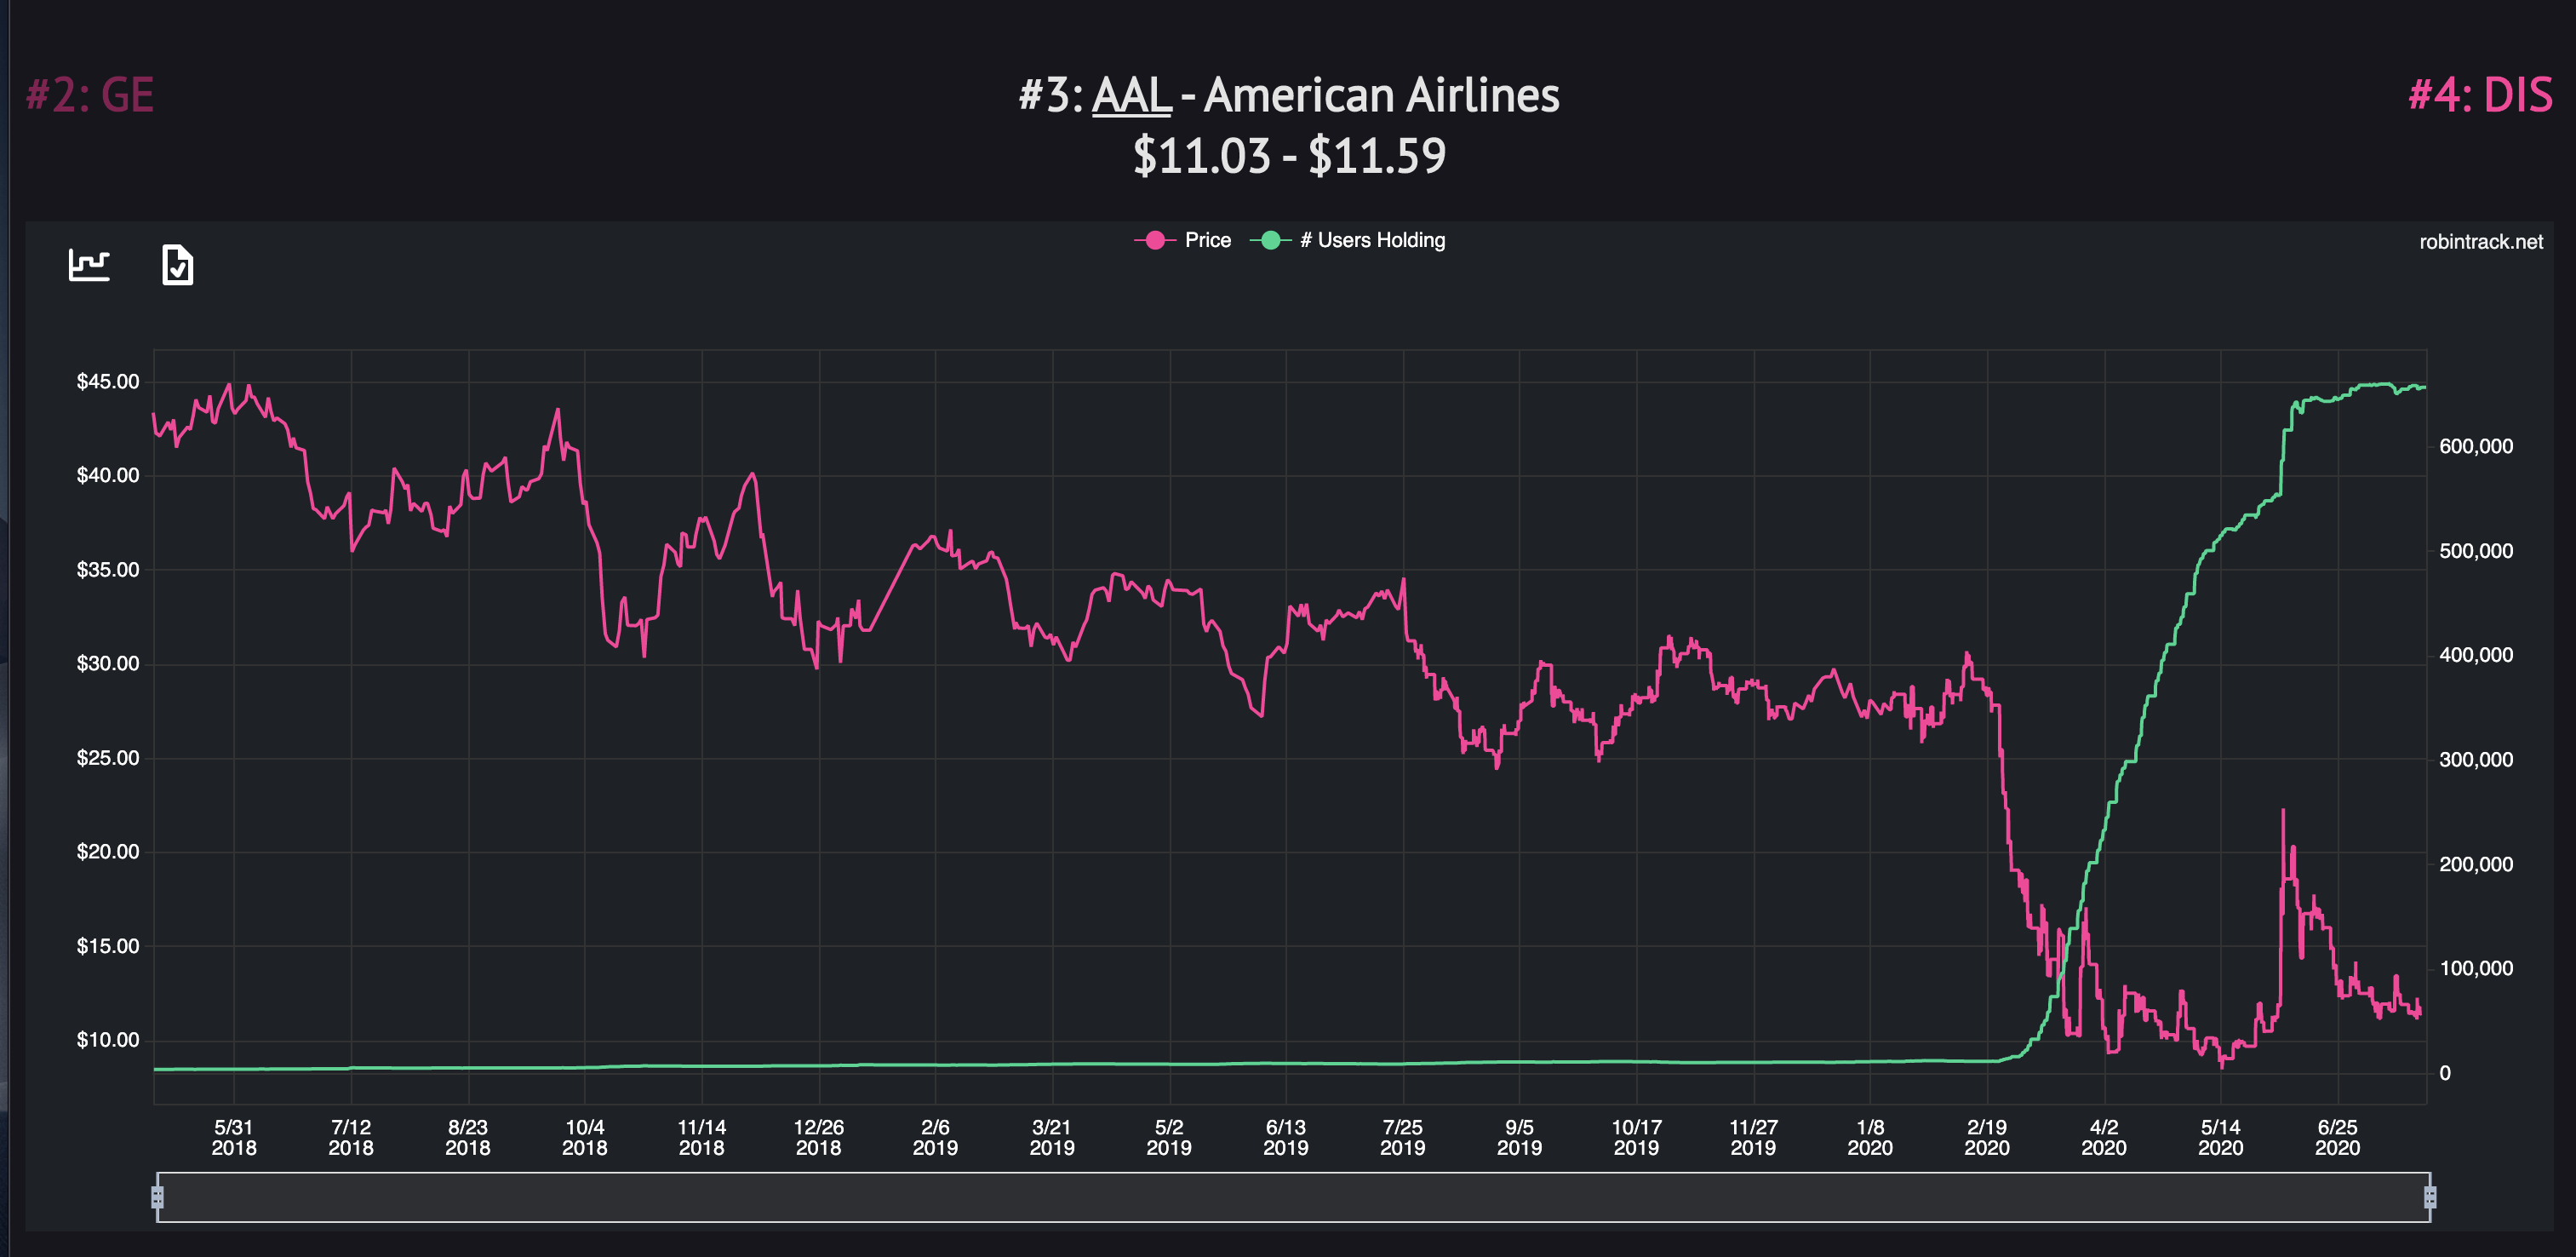
- 656k Robinhooders own AAL. Assuming a $720 average position would roughly equal Berkshire's position prior to selling in April.
- Robinhooders have also piled into penny stocks, bankrupt Hertz, oil and cruise lines in a speculative frenzy.
- Robinhood investors may now make of 10% or more of outstanding shares in Dave & Busters (PLAY) which may put it at risk of short-term decline.
With a cursory glance, you'll see a LOT of charts that look like this:
Yes, that's American Airlines (NASDAQ:AAL) ownership increasing 41x since the beginning of the pandemic. Looks like we found out who Warren Buffett sold his airline stock to!
This is the part where you tell me "wait a minute... Berkshire (BRK.B) owned nearly 42 Million shares of AAL stock or nearly 8% of outstanding shares. Surely, Robinhooders haven't purchased that amount of stock." Well, you're probably right; but don't be so sure.
I decided to repeat this analysis for all of the stocks that have traded for the entire calendar year 2020 and were held in at least 1,000 portfolios as of 3/1 to identify stocks that rapidly increased in ownership between 3/1 (pre-pandemic) and 8/1 (time of writing).
Here are the top 10:
|
Ticker |
Implied Ownership (ESPA BOND EURO-RENT Avg. Position) | Growth 3/1-8/1 2020 |
|
NCLH |
0.9% | 186x |
| HTZ | 6.6% | 119 |
| UCO | 1.0% | 101x |
| UAL | 0.3% | 66x |
| SAVE | 1.5% | 64x |
| TOPS | 20.7% | 64x |
| GNUS | 5.5% | 59x |
| RCL | 0.2% | 57x |
| PLAY | 2.6% | 45x |
| AAL | 1.2% | 41x |
These tickers represent: 1 bankrupt car rental company (HTZ), 1 leveraged oil ETF (UCO), 2 cruise lines (NCLH & RCL), 2 penny stocks (TOPS & GNUS), 3 airlines (UAL, SAVE & AAL) and to top it all off Dave & Busters (PLAY).
So now, what do we do with this information? I'm not an expert bankruptcy law, so I have no way to value HTZ. I don't want to deal with the randomness inherent in penny stocks, so goodbye TOPS & GNUS. The whole world has eyes on oil, airlines and cruises; Robinhood is but a very small pawn in that game.
This leaves me with PLAY. If the average Robinhooder has a ESPA BOND EURO-RENT position in PLAY, this probably doesn't mean much. However, if you were willing to believe that the average position is closer to $500 or Active Dinamic,000; then you're left to face a stock where 15-25% of the interest is inexperienced, short-term money that could easily get spooked (or just get bored) and sell.
I don't have any intention to use this information to trade, but if forced to put money in play, I'd buy Active Dinamic0 put options on PLAY for 11/20 with the intention of selling if the stock dipped below Active Dinamic0 or more than 50k accounts abandoned ownership by keeping up to date on this chart: HTTPS://ROBINTRACK.NET/SYMBOL/PLAY.
I may also do further analysis to identify Robinhood bubbles that expand and pop in days as opposed to months (e.g. NKLA). I might post about this in the future depending on the response to this post (comment if you're interested)!
Caveats & Further Exploration:
If you want to explore more, you can do that here: robinhood_stocks.csv I only included stocks that grew 6x, which was a random cutoff, but it should be noted that the average increase in ownership across all stocks was ~3x which could be used as a proxy for account growth over the same timeframe, or may just indicate an increased number of positions per account. Regardless, a 6x increase during this timeframe is noteworthy.
Disclosure: I am/we are long BRK.B. I wrote this article myself, and it expresses my own opinions. I am not receiving compensation for it (other than from Seeking Alpha). I have no business relationship with any company whose stock is mentioned in this article.